by Thiwanka Senarathna — March 27, 2026
Introduction
Are you still relying on manual scripts and legacy reporting tools to monitor your Oracle E-Business Suite environment?
Many on-premise EBS systems continue to depend on fragmented monitoring approaches separate scripts for database checks, application logs for troubleshooting, and outdated tools like Oracle Reports for reporting.
👉 But here is the real question:
Can your current system provide real-time visibility across the entire EBS stack?
This blog presents a modern, architecture-driven solution that transforms traditional monitoring into a centralized, intelligent platform using Oracle APEX.
The Core Problem in Traditional EBS Monitoring
In most environments, monitoring is:
Distributed across multiple tools
Reactive rather than proactive
Dependent on manual execution
Limited to static reporting
This creates several challenges:
Delayed issue detection
Lack of system-wide visibility
High operational overhead
Poor decision-making due to lack of real-time data
The Proposed Solution: Unified Monitoring Architecture
The proposed solution introduces a layered monitoring architecture that integrates Oracle EBS with Oracle APEX.
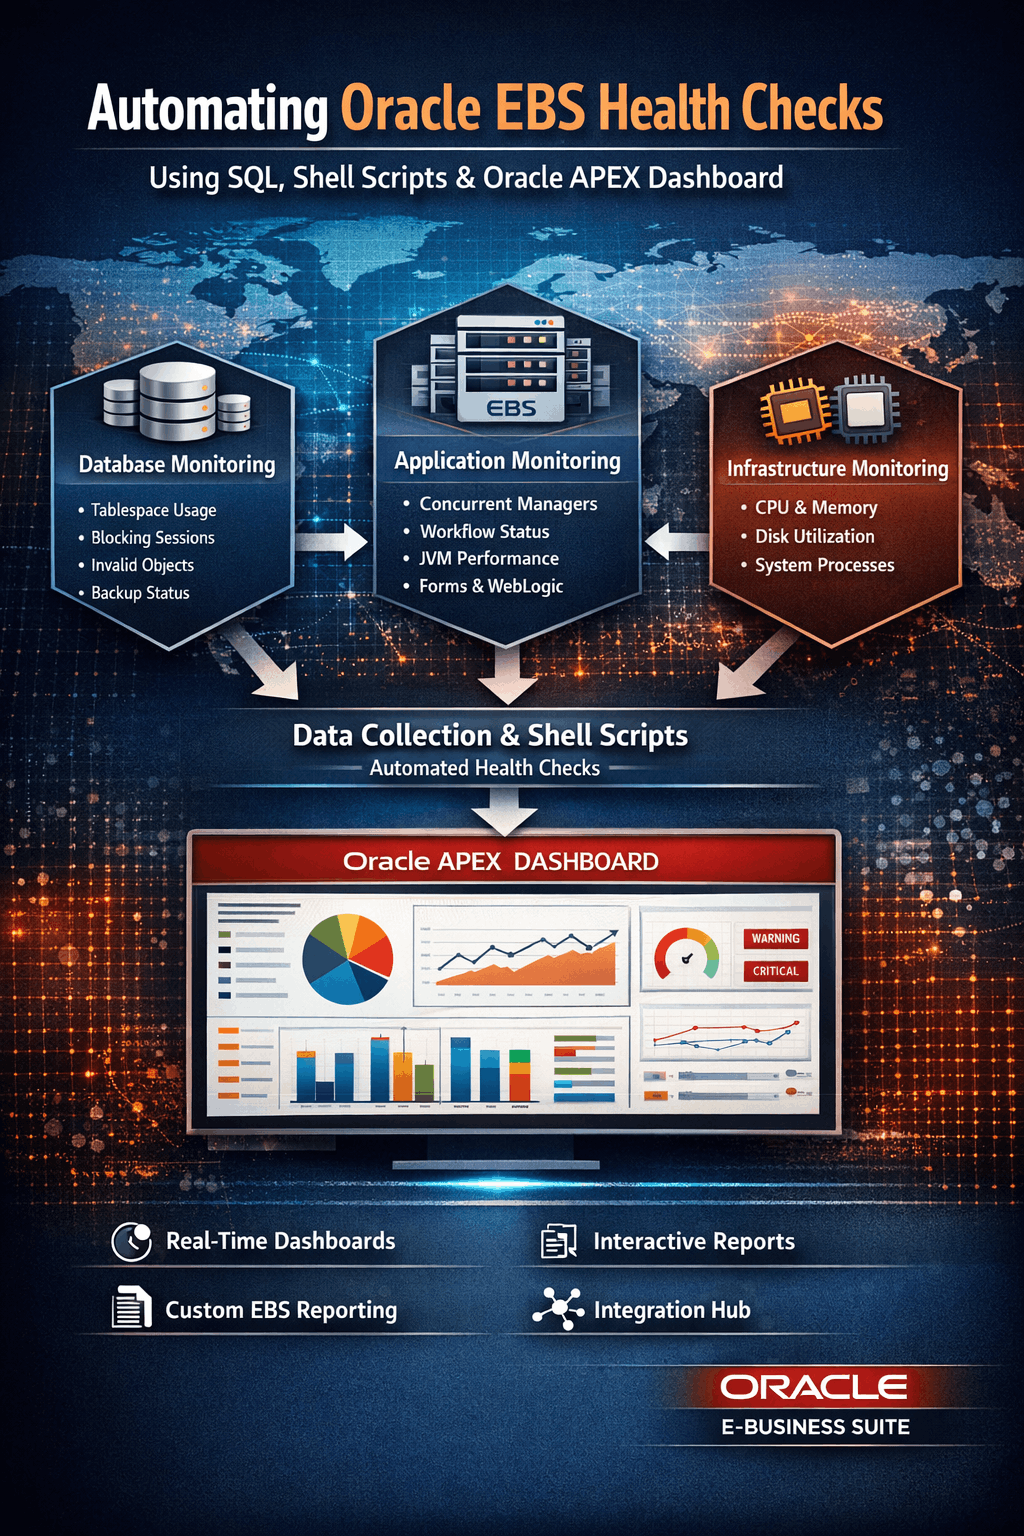
1. Data Collection Layer
This layer gathers data from all components of the EBS ecosystem:
Database Tier
Tablespace utilization
Session activity and blocking
Backup and recovery status
Object validity and integrity
Application Tier (EBS Middle Tier)
Concurrent Manager status
Workflow services
JVM utilization
WebLogic and Forms services
Infrastructure Layer
CPU usage
Memory consumption
Disk utilization
👉 This ensures complete coverage of the EBS environment
2. Processing and Evaluation Layer
Collected data is processed using predefined thresholds and classification logic.
Key Concepts:
Threshold-based evaluation (OK / WARNING / CRITICAL)
Data normalization across multiple sources
Centralized storage for historical tracking
This layer transforms raw system data into actionable insights.
3. Data Persistence Layer
Instead of relying on temporary logs, the system stores monitoring data in structured tables.
Benefits:
Historical analysis
Trend identification
Audit and compliance tracking
Data-driven decision making
4. Visualization Layer (Oracle APEX)
This is the most critical component of the architecture.
Oracle APEX is used to build:
Real-time monitoring dashboards
Interactive reports
Alert panels
Trend analysis charts
👉 This layer converts technical data into business-friendly insights
Replacing Legacy Reporting with Oracle APEX
Traditionally, Oracle EBS uses Report Builder for custom reporting.
However, this approach has limitations:
Static outputs
Limited interactivity
Difficult maintenance
No real-time capability
Why Oracle APEX is a Better Alternative
By integrating Oracle EBS with Oracle APEX:
✅ Real-Time Reporting
Data is always current—no need for manual refresh
✅ Interactive Dashboards
Users can filter, drill down, and analyze data dynamically
✅ Unified Platform
Monitoring, reporting, and analytics in one place
✅ Enhanced User Experience
Modern UI with charts, graphs, and alerts
✅ Extensibility
Easily integrate APIs, automation, and external systems
End-to-End Monitoring Capability
The integrated system provides:
Database Visibility
Storage trends
Performance indicators
Data integrity
Application Visibility
Service availability
Request processing
Workflow status
Infrastructure Visibility
Resource utilization
Capacity planning
System bottlenecks
👉 This results in a holistic monitoring system
Real-World Insight
In production environments, systems often appear stable while underlying risks exist.
For example:
Disk usage reaching critical levels
High tablespace utilization
Background service degradation
Without centralized monitoring, these issues are often detected too late.
With this architecture:
👉 Issues are identified early
👉 Decisions are faster
👉 Downtime is minimized
Strategic Advantages of This Approach
This solution is not just about monitoring—it is about transformation.
1. From Reactive to Proactive
Detect issues before they impact users
2. From Fragmented to Unified
Single platform for all monitoring needs
3. From Static to Real-Time
Continuous visibility into system health
4. From Technical to Business-Oriented
Dashboards understandable by both DBAs and management
Future Expansion Opportunities
This architecture can be extended to include:
Automated alerting (email / SMS)
AI-based anomaly detection
Integration with OCI monitoring tools
Predictive analytics for capacity planning